Tasks
Generate Diagram
Renders a diagram from a Mermaid text definition and attaches the image to the stub. Useful for process flows, approval paths, timelines, and system overviews.
This task takes a Mermaid diagram definition, which is a short text description of a diagram, and renders it into a PNG or SVG image that is attached to the stub.
You can use substitution to build the definition from the stub's data, so the diagram reflects what actually happened on the stub.
Use the Mermaid Live Editor to build and preview your definition, then paste it into the task's diagram_definition property.
Example Uses
- Show the approval path a stub followed, on the stub itself
- Attach a process flow to a client onboarding pack
- Produce a timeline of a project's phases
- Document a system or integration overview in a report
Basic usage
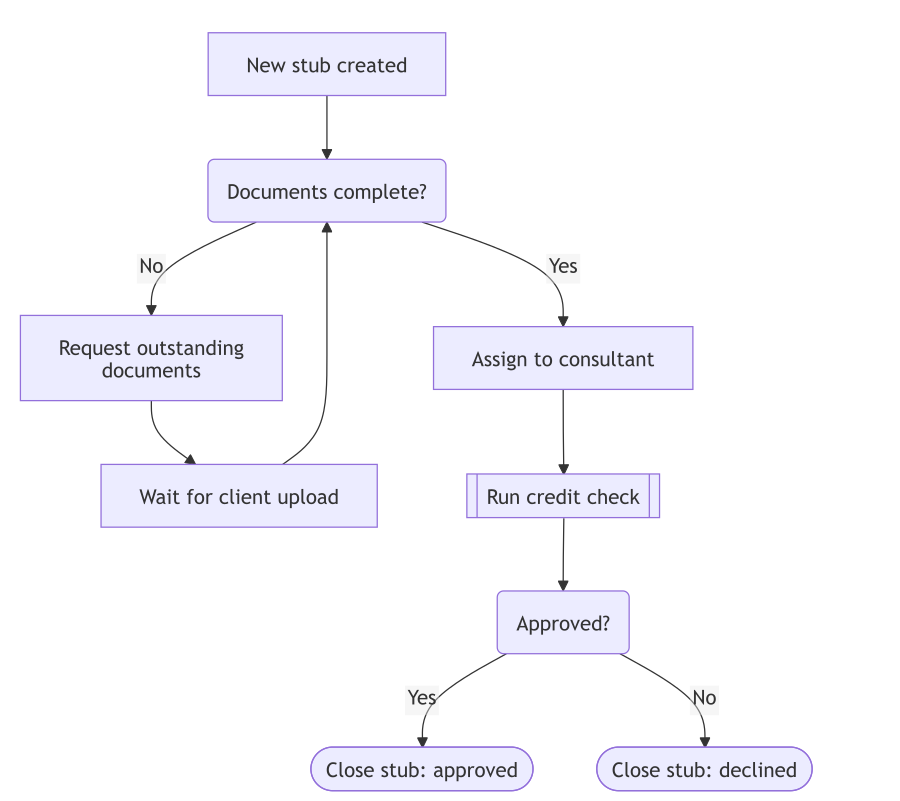
Image generated :
Parameters
diagram_definition required string
The Mermaid definition of the diagram, as a single string. Use \n for line breaks.
Supported diagram types include flowcharts, sequence diagrams, class diagrams, state diagrams, entity relationship diagrams, pie charts, Gantt charts, user journeys, mindmaps, timelines, quadrant charts, requirement diagrams, git graphs, sankey diagrams, block diagrams, architecture diagrams and treemaps.
A definition may be up to 20 000 characters long and contain up to 200 connections.
output_settings required object
The details of the file to create.
Show child attributes
content_type required string
The type of file to produce. Use image/svg+xml for a vector image that stays sharp at any size.
Supported: image/png | image/svg+xml
output_filename required string
The filename to give the generated file. Example onboarding_flow.png
image_settings optional object
The size and background of the image. Unlike a chart, a diagram already has a natural size, so all of these are optional.
Show child attributes
image_width optional number
The width of the image in pixels.
image_height optional number
The height of the image in pixels.
scale optional number
How much to enlarge the diagram's natural size, between 1 and 4. Only used when no width or height is given.
Default: 2
background_color optional string
The background color of the image. Accepts a color name, a hex value, an rgb() or hsl() value, or transparent to keep the image see-through.
Default: white
How the size is decided:
Wide diagrams, such as a large system overview, are usually best given image_width only. Setting both dimensions on a wide diagram leaves large empty bands above and below it.
The finished image may not be larger than 25 million pixels, for example 5000 x 5000.
mermaid_config optional object
Mermaid settings that change how the diagram looks, such as the theme.
Supported settings are theme, themeVariables, look, wrap, darkMode and logLevel, plus a section of settings named after the diagram type, such as flowchart, sequence, gantt, class, state, er, pie, journey, mindmap, timeline, gitGraph or quadrantChart.
Anything else, including securityLevel, htmlLabels, themeCSS and fontFamily, is ignored. Diagrams are always rendered with HTML labels turned off, so that no HTML or external styling ends up in the image.
Result
Properties
file object
The details of the image that was created.
attachments object[]
The generated image, which is automatically attached to the stub or stubpost.
Substitution
Every string in the params is processed for substitution before the diagram is rendered, so stub data can be injected into both the definition and the filename:
Mermaid's hexagon node shape is written A{{text}}, and double curly braces are also how substitution marks a value to be replaced. A definition containing {{ }} as a shape fails with a message about interpolation.
Use another shape instead, such as [text], (text), ([text]) or {text}, or wrap that part of the definition in a raw block:
{{{{raw}}}}A{{hexagon}}{{{{/raw}}}}
Examples
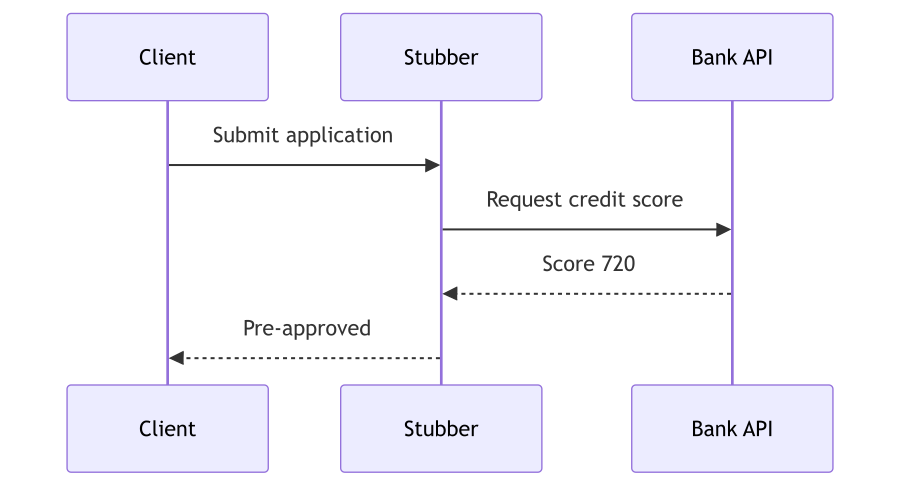
A sequence diagram with a theme
Image generated :
A vector (SVG) diagram
Ask for image/svg+xml when the diagram needs to stay sharp when zoomed or printed. Size settings are not needed, because a vector image has no fixed pixel size.
A Gantt chart
Common errors
The task fails and returns a message when a parameter is missing or the definition cannot be drawn:
diagram_definition not in params— no definition was given.diagram_definition must be a non-empty mermaid definition string— the definition was empty.Invalid mermaid definition: ...— the definition has a syntax error. The message includes the line that could not be read.diagram_definition exceeds 20000 characters— the definition is too long.output_settings not in params,output_settings output_filename is nulloroutput_settings content_type is null— the output details are incomplete.Unsupported output_settings content_type '...'— thecontent_typewas something other thanimage/pngorimage/svg+xml.Requested diagram output of ... exceeds 25000000 pixels— the requested size is too large.- A message about failing to interpolate the params — usually the
{{ }}hexagon shape described above.
Related
- Generate Chart — bar, line and pie charts from a Chart.js definition.
- Dynamic Image Generator — images built from a Fabric.js canvas.