Tasks
Generate Chart
Renders a chart from a Chart.js definition and attaches the image to the stub. Useful for reports, dashboards, progress summaries, and charts emailed to clients.
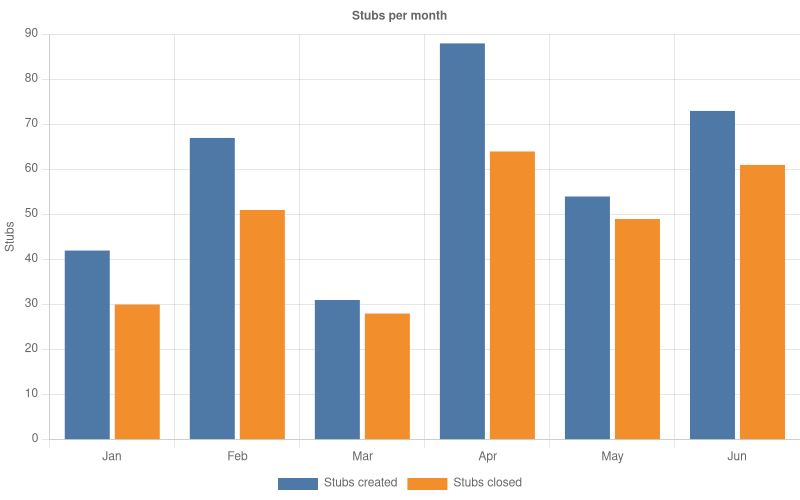
This task takes a Chart.js chart definition and renders it into a PNG image, which is attached to the stub.
You can use substitution to inject data from the stub into the chart, so the labels and values come from the stub's data instead of being fixed.
Example Uses
- Attach a monthly volume chart to a management report
- Show a client their credit score over time
- Add a breakdown of stub outcomes to a PDF or an email
- Chart the results captured on a stub during an inspection
Basic usage
Image generated :
Parameters
image_settings required object
The size and background of the image to generate.
Both dimensions are required, because a chart has no size of its own to fall back on. Charts scale their text and grid lines to the size you ask for, so a chart meant for a PDF or an email usually looks better at 800 x 500 or larger.
Show child attributes
image_width required number
The width of the image in pixels.
image_height required number
The height of the image in pixels.
background_color optional string
The background color of the image. Accepts a color name, a hex value, an rgb() or hsl() value, or transparent to keep the image see-through.
Default: white
output_settings required object
The details of the file to create.
Show child attributes
content_type required string
The type of file to produce. Charts can only be produced as PNG.
Supported: image/png
output_filename required string
The filename to give the generated image. Example monthly_stubs.png
chart_definition required object
The Chart.js chart definition. Anything the Chart.js documentation shows for these keys works here, as long as it can be written as JSON.
Show child attributes
type required string
The kind of chart to draw.
One Of: bar | line | pie | doughnut | polarArea | radar | bubble | scatter
data required object
The labels and datasets to plot. Each dataset holds the values and how they are drawn, such as label, data and backgroundColor.
options optional object
Titles, legend position, axis settings, colors, and anything else Chart.js supports.
Chart.js options that have to be written as JavaScript functions, such as custom axis tick callbacks or tooltip formatters, cannot be used. Only values that can be written as JSON reach the chart.
Result
Properties
file object
The details of the image that was created.
attachments object[]
The generated image, which is automatically attached to the stub or stubpost.
Examples
Inject stub data into a chart
Use substitution to build the labels and values from the stub's data instead of hard coding them.
Use a different chart type
Changing type is usually all that is needed to get a different chart. This example produces a doughnut chart on a 600 x 400 image.
Image generated :
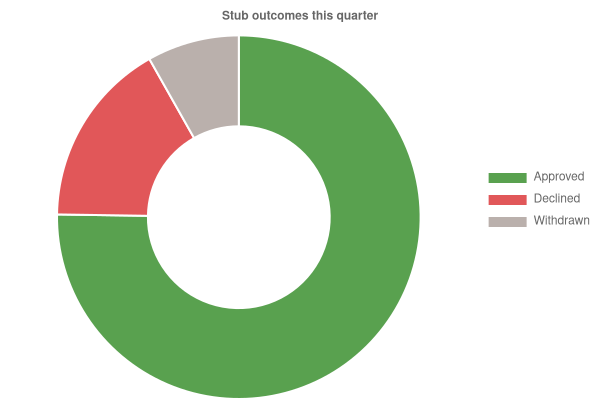
Chart with a transparent background
Useful when the image is placed onto a colored background, such as a branded email or a dark themed document.
Common errors
The task fails and returns a message when a parameter is missing or cannot be used:
chart_definition not in params— no chart definition was given.image_settings image_width is nullorimage_settings image_height is null— one of the required dimensions is missing.output_settings not in params,output_settings output_filename is nulloroutput_settings content_type is null— the output details are incomplete.Unsupported output_settings content_type '...'— thecontent_typewas something other thanimage/png.
Related
- Generate Diagram — flowcharts and other diagrams from a text definition.
- Dynamic Image Generator — images built from a Fabric.js canvas.